See how your feedback is trending
The Analytics page shows how much feedback a product gets: new ideas, votes and comments over time. It compares each number with the period before.
Who can use it
All plans. Anyone on your team who can see the product can open its analytics, including people with the Viewer level.
Open the page
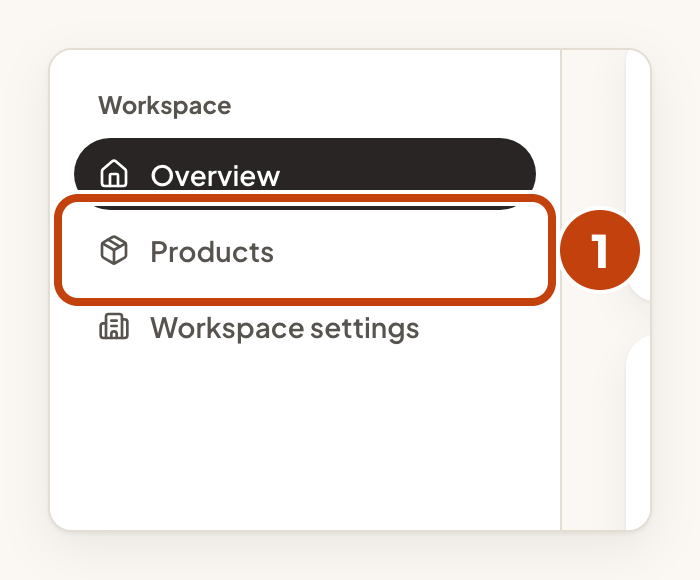
- Select Products in the sidebar.
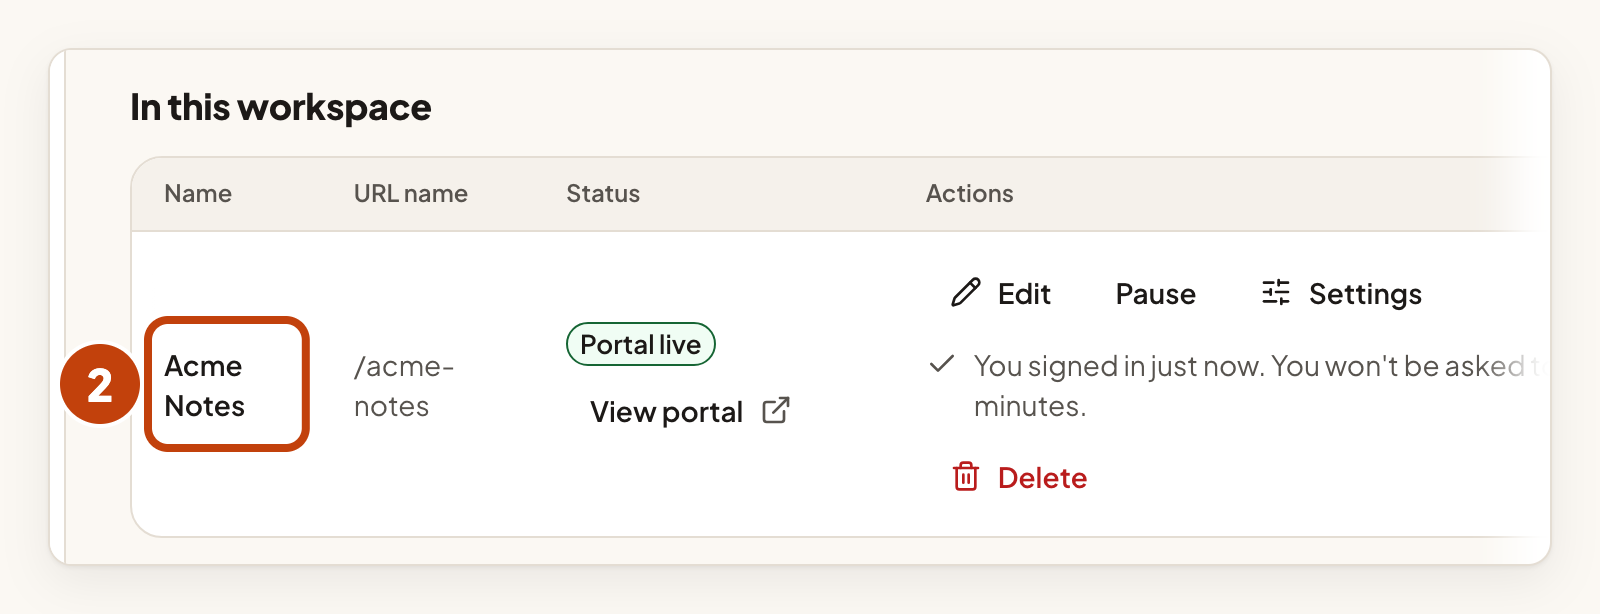
- Select your product's name.
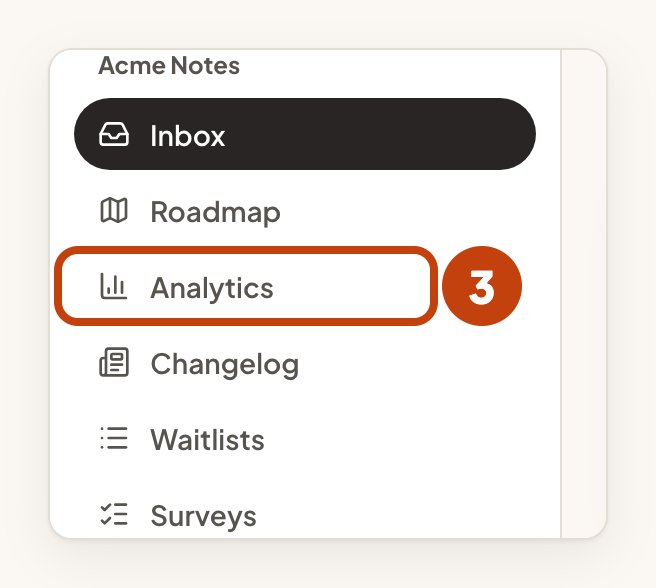
- Select Analytics in the sidebar.
Choose a time range
- Select Last 7 days, Last 30 days, Last 90 days or Last 365 days.
- Under Board, choose the board to look at.
- Select Show board.
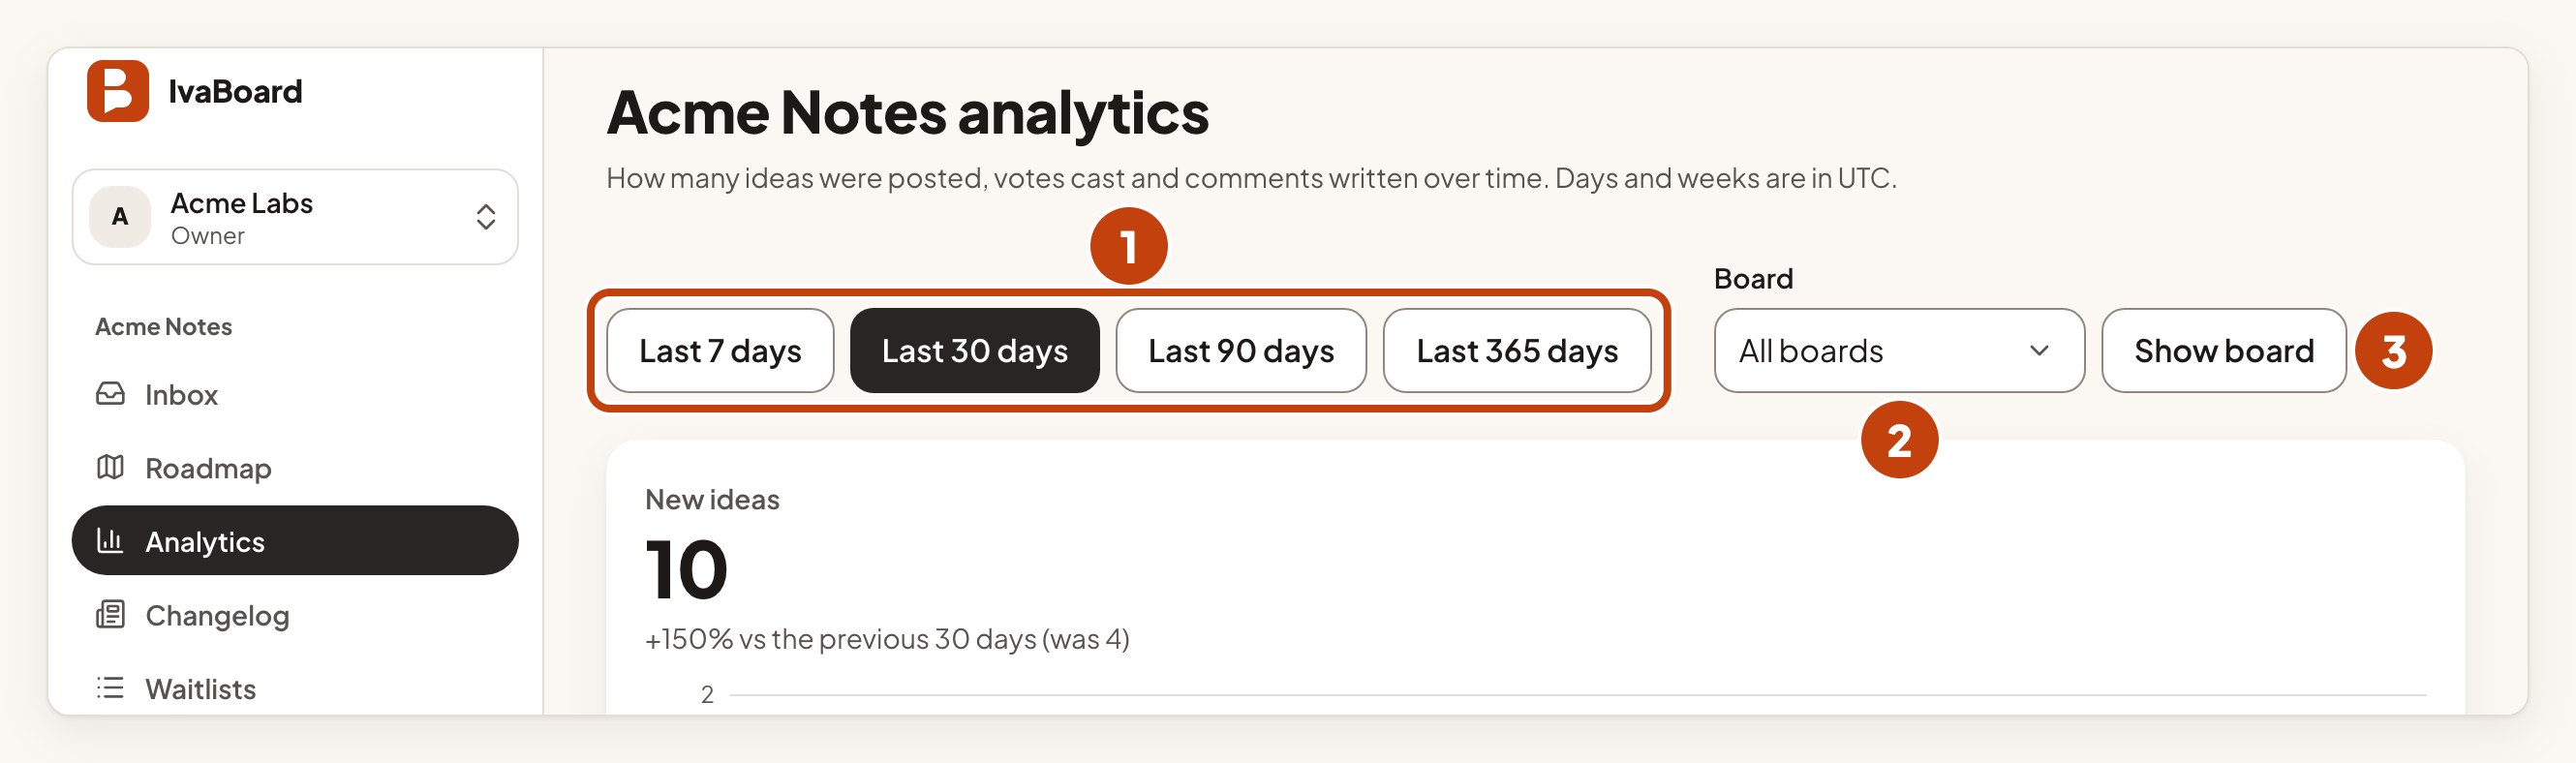
The default range is Last 30 days. To see the whole product, choose All boards under Board, then select Show board.
Read the numbers
Three cards show New ideas, Votes and Comments. Each card has a chart. Each card also compares the period with the one before, for example "+20% vs the previous 30 days". If the earlier period had none, the card says it is up from none.
To see the same numbers as a table, select Show the numbers as a table. The table has one row for each day, or one row for each week when you choose Last 365 days.
- Days and weeks use UTC.
- New ideas count approved ideas only. Declined, hidden, merged and awaiting-review ideas are left out.
- Votes and comments count the votes and public comments on those ideas. Team-only notes and deleted comments are left out.
Good to know
The charts count what is in the product today. If an idea is removed or approved later, the numbers for the day it was posted change. A merge moves votes to the kept idea and keeps their original dates.
If you see Analytics are not available to you, ask an owner or an admin for access to the product.
Example
For example, Sam opens the analytics for Acme Notes and selects Last 7 days. The Votes card says +20% vs the previous 7 days, so Sam knows votes went up this week.
